You'll learn how to configure debugging sessions in CLI for Microsoft 365.
Prerequisites
To go through the article we need to have our development environment. There are two main ways to create the environment: locally and using Remote Development Containers.
If you want to use your local environment, follow the article Minimal Path to Awesome. For Remote Development Containers, follow GitHub Codespaces & Visual Studio Remote Development Container.
In this article, we'll be using the environment based on GitHub Codespaces.
Table of Contents
- Prerequisites
- Table of Contents
- Building the project
- Debugging CLI
- Debugging tests
- Debugging tests via Test Explorer
- Cleaning up
- Basic actions in the debug mode
- Conclusion
Building the project
Each time we make the changes, we need to rebuild the project.
We do it by running the following command:
npm run buildDebugging CLI
For the CLI debugging we'll need to define the arguments. The debugger will run that m365 command in debug mode. In simple words, we'll be able to dig into what happens when we run a command such as m365 login or m365 aad policy list.
What can we do in debug mode? If you scroll down to Basic actions in the debug mode, you'll find some useful resources. For now, let's focus on setting up the environment for debugging.
Opening launch file
To configure the command we'd like to debug, we'll edit .vscode/launch.json. We can open it directly from the file explorer:
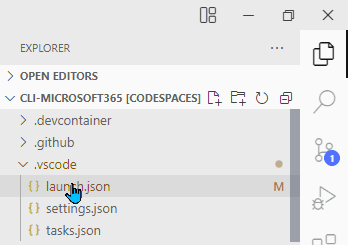
Opening launch.json from file explorer
We can also open it from the Run and Debug bar (1). We need to click a little gear icon (2) next to the Debug CLI dropdown:
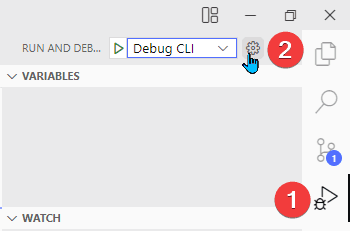
Opening launch.json from run and debug bar
Setting the arguments
The arguments need to be entered under the configurations array (1). We'll edit the one with the name Debug CLI (2). Our arguments need to go to the args array (3):
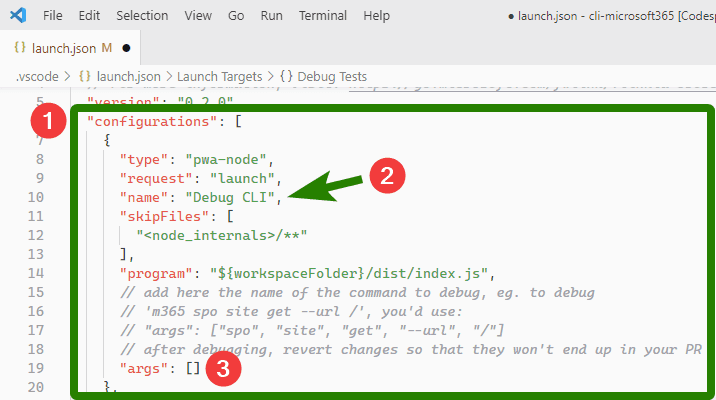
Finding proper section in launch file
The comments above the args array explain how to use it.
In my example, I troubleshoot usage of the incorrect value for --output. I'd like to debug what's happening when I run:
m365 version --output asdasdTranslated to the array, it'll look like:
"args": ["version", "--output", "asdasd"]Let's save the file and run the debug mode.
Running the debug mode
To run debug mode we can simply hit the F5 button. We can also run it by opening the Run and Debug tab (1) and clicking the play button (2):
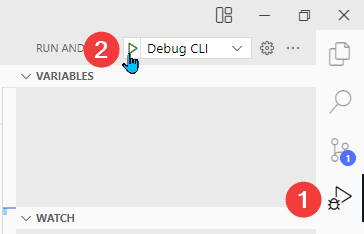
Running the debug mode from the Run and Debug tab
How to confirm we entered the debug mode? We can notice a few differences:
- The little bar with debug controls will appear
- The panel tab will switch to the Debug Console
- The bottom bar will be orange
The differences are outlined in the screenshot below:
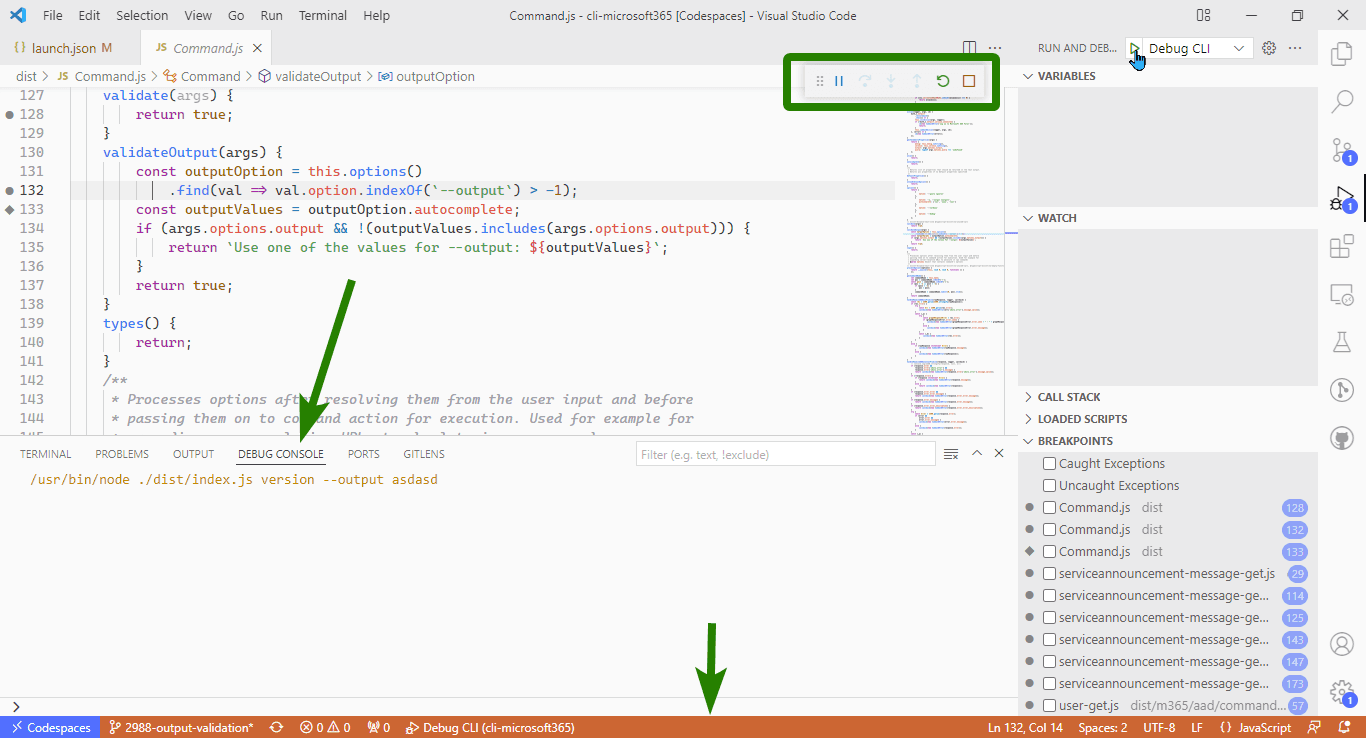
Debug mode differences
Debugging tests
We now know how to debug command execution.
But what about the tests? Tests are an important part of CLI for Microsoft 365. Current (and desired) test coverage is 100%. It means that for many of the changes we might need to troubleshoot the tests, too.
There are several options for running the tests. As described on Adding a command wiki page:
To run just your tests, either add
.onlyto your test suite (eg.describe.only(commands.MY_COMMAND)) or update the glob in the.mocharc.jsonfile,specproperty to match the path to your test files, likedist/m365/aad/commands/approleassignment/**/*.spec.js.
Below we're exploring all these options. We're also talking about the options, which are not listed.
Adding .only to the test suite
The first option is to add .only to the test suite. We need to open a test file something.spec.ts. Inside, we replace describe with describe.only:
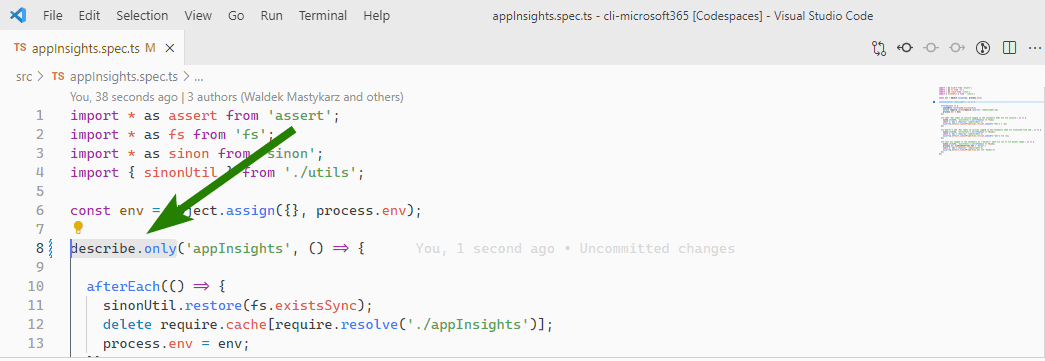
Replacing describe with describe.only
If we want to run only one test, we can add .only after the it statement:
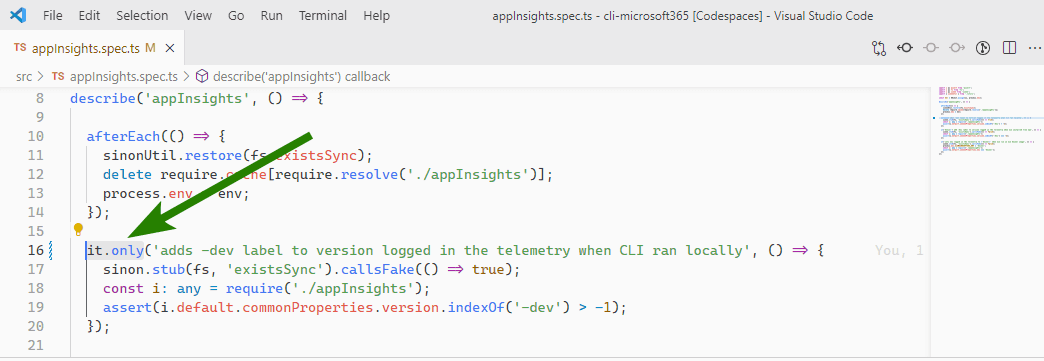
Replacing it with it.only
In any case, we need to compile the code using npm run build. When the build task is finished, we can run the debug mode.
Steps to run the debug mode are described under Running the debug mode for tests. Before going there, let's explore other options for limiting the number of tests.
Updating .mocharc.json
All the settings for Mocha (test framework used in the project) are stored in the .mocharc.json file. The file is in the root folder of the repository.
The file contains the argument spec. It is responsible for specifying the files to be included in the test suite. If we want to run tests from only one file, we need to supply its path to the spec argument.
We also need to remember that the path should lead to the compiled file. We'll simply change the src folder to the dist folder and the extension from ts to js.
See the code block below for the example:
 src/appInsights.spec.ts
dist/appInsights.spec.js
^                     ^
folder name           extension
The updated file will look like the one below:
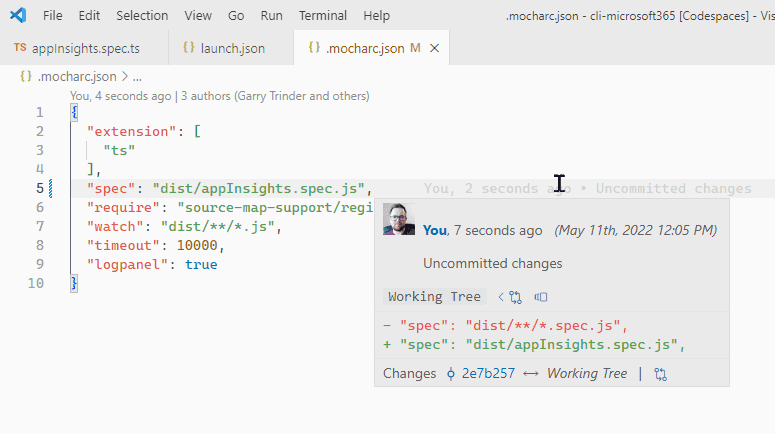
.mocharc.json file with updated spec property
Overwriting the launch file config
The launch.json file we edited for CLI debugging contains another configuration object named Debug Tests. The object has no arguments (property args). It uses the default configuration, pulled from .mocharc.json file.
However, we can add the arguments ourselves. We also need to tell Mocha to ignore the config file.
The example args array we can set would be:
"args": [
  "dist/appInsights.spec.js",
  "--no-config"
],
The first argument in the array specifies the file (or files if we use wildcard) to be given to Mocha. The last argument tells Mocha to ignore its config file.
As we only run a couple of tests, we don't need to change the default timeout value (which is 2000 ms). If we want to increase the timeout, our args array would look as below:
"args": [
  "dist/appInsights.spec.js",
  "timeout",
  "10000",
  "--no-config"
],
Running the debug mode for tests
After we set we can now run Debug Tests configuration. We need to go to Run and Debug tab (1) choose the configuration from the dropdown (2) and then hit the play button (3):
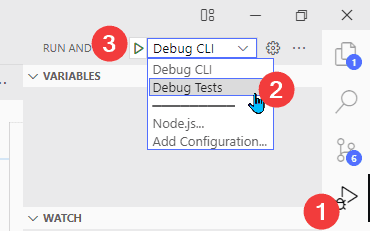
Running Debug Tests configuration
The debug console will now indicate that only tests from a single file run. We can see it from the number of tests and the execution time:
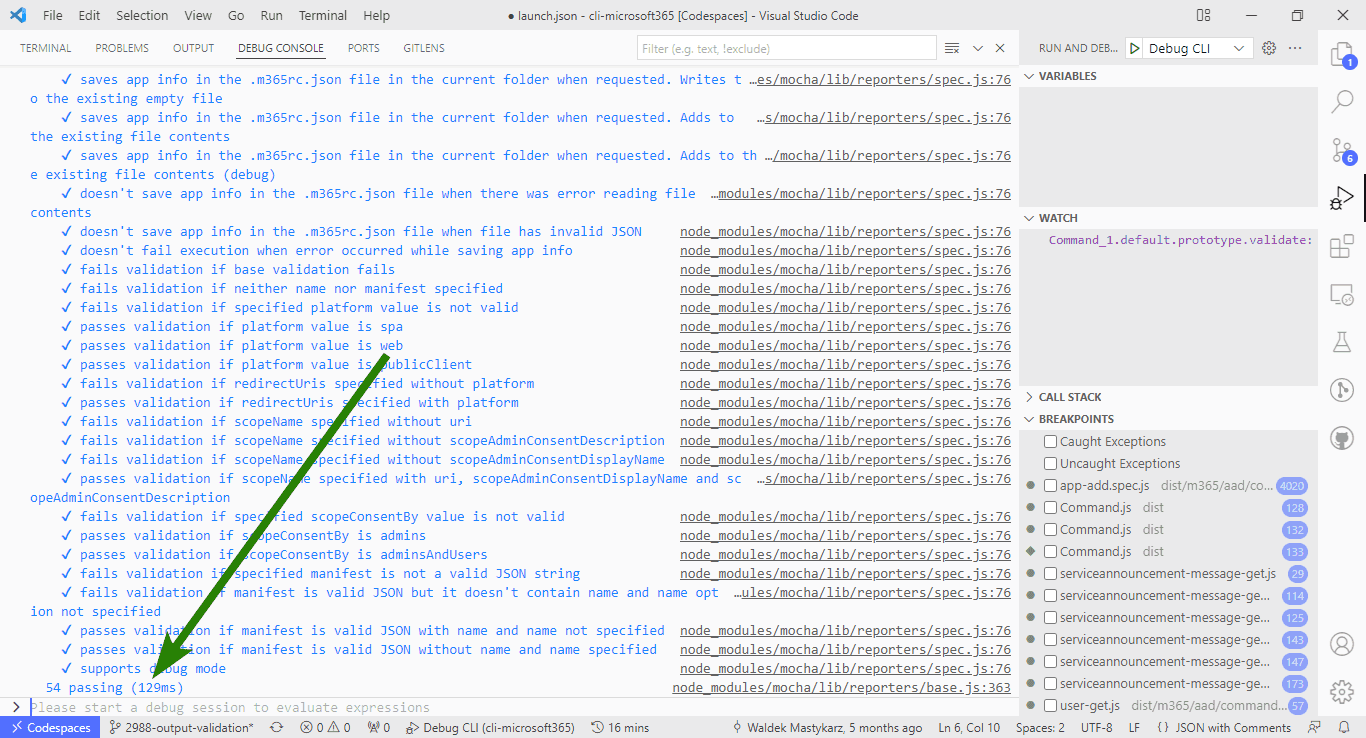
Number of tests and execution time for a single file
If all tests run, the number will be bigger than 9.000 and the execution time will usually be more than 10 seconds:
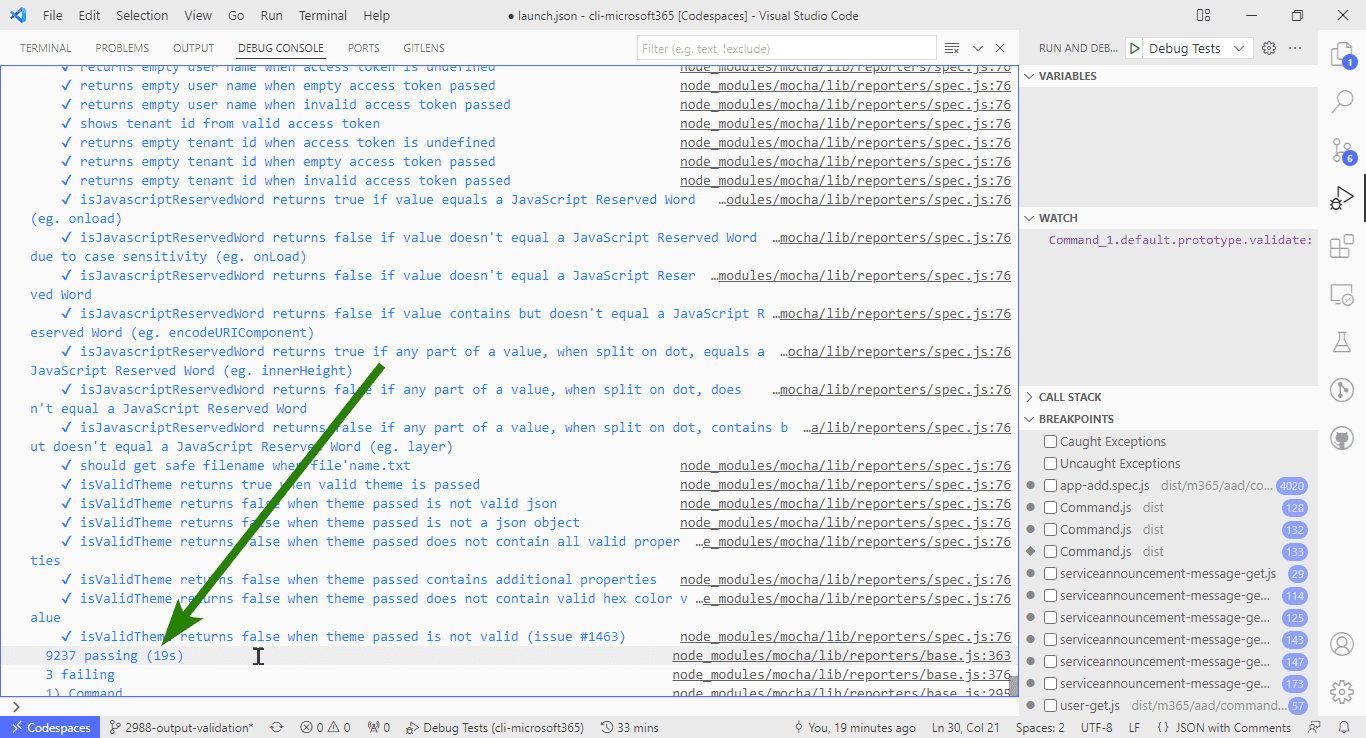
Number of tests and execution time for all tests
Debugging tests via Test Explorer
Test Explorer is an addon to Visual Studio Code, which provides an interface to run tests from the sidebar. The addon has been recently added to the default devcontainer file.
As with all the methods described above, the prerequisite is to build the project.
Once the project is built, we can click the Test Explorer UI icon in the sidebar (1 on the image below). Our sidebar will show a list of all the files containing tests. Using the toggle left to the file title, we can expand the list of tests in that file.
By moving our mouse over the test or file title, we will see three buttons. Clicking the bug button (2) runs the test (or tests) in the debug mode. Play button icon (3) runs the test. File icon (4) opens the test's source file.
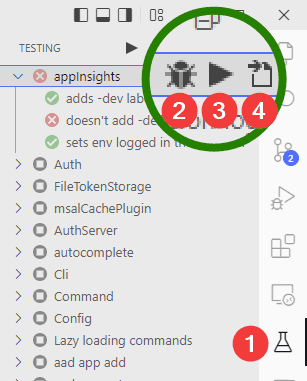
Test Explorer action buttons
Cleaning up
Ok, we configured our environment for testing. Now we only need to talk about cleaning it up.
The reason for the cleanup is to make sure that we don't push our changes to the repository. We don't want the next person to run exactly the same tests as we did.
To clean our codebase, we need to revert changes made to the files. The easiest way to do that is to go to the Source Control tab and find the affected file(s). Then we right-click on them and choose Discard changes:
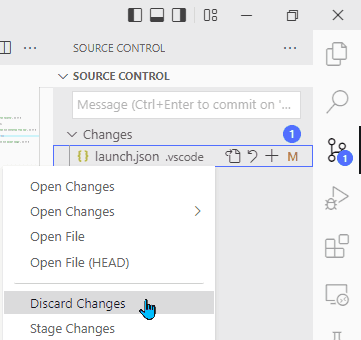
Discarding changes made to launch.json file
We can also do that from the console. The command to use is git checkout with the file path:
git checkout .vscode/launch.jsonAfter reverting all the files we edited to set our debugging environment up, we should be ready to commit our changes.
Basic actions in the debug mode
Ok, we know how to set the environment, but what we can actually do in the debug mode? This article doesn't intend to cover such a big topic. Below you'll find some helpful resources to get started.
To learn more about what you can do in the debug mode you can read the Debugging in Visual Studio Code article.
In the linked article you'll learn how to:
- Control the debug flow with debug actions
- Set breakpoints or logpoints
- Inspect data during the execution
Conclusion
There's more than one way to set our debugging environment for CLI for Microsoft 365. This article covered multiple approaches to do so.
Once we have our environment ready, we can start debugging. I bet it's going to be even more interesting!
Happy debugging!